

See your whole business today, not after month-end
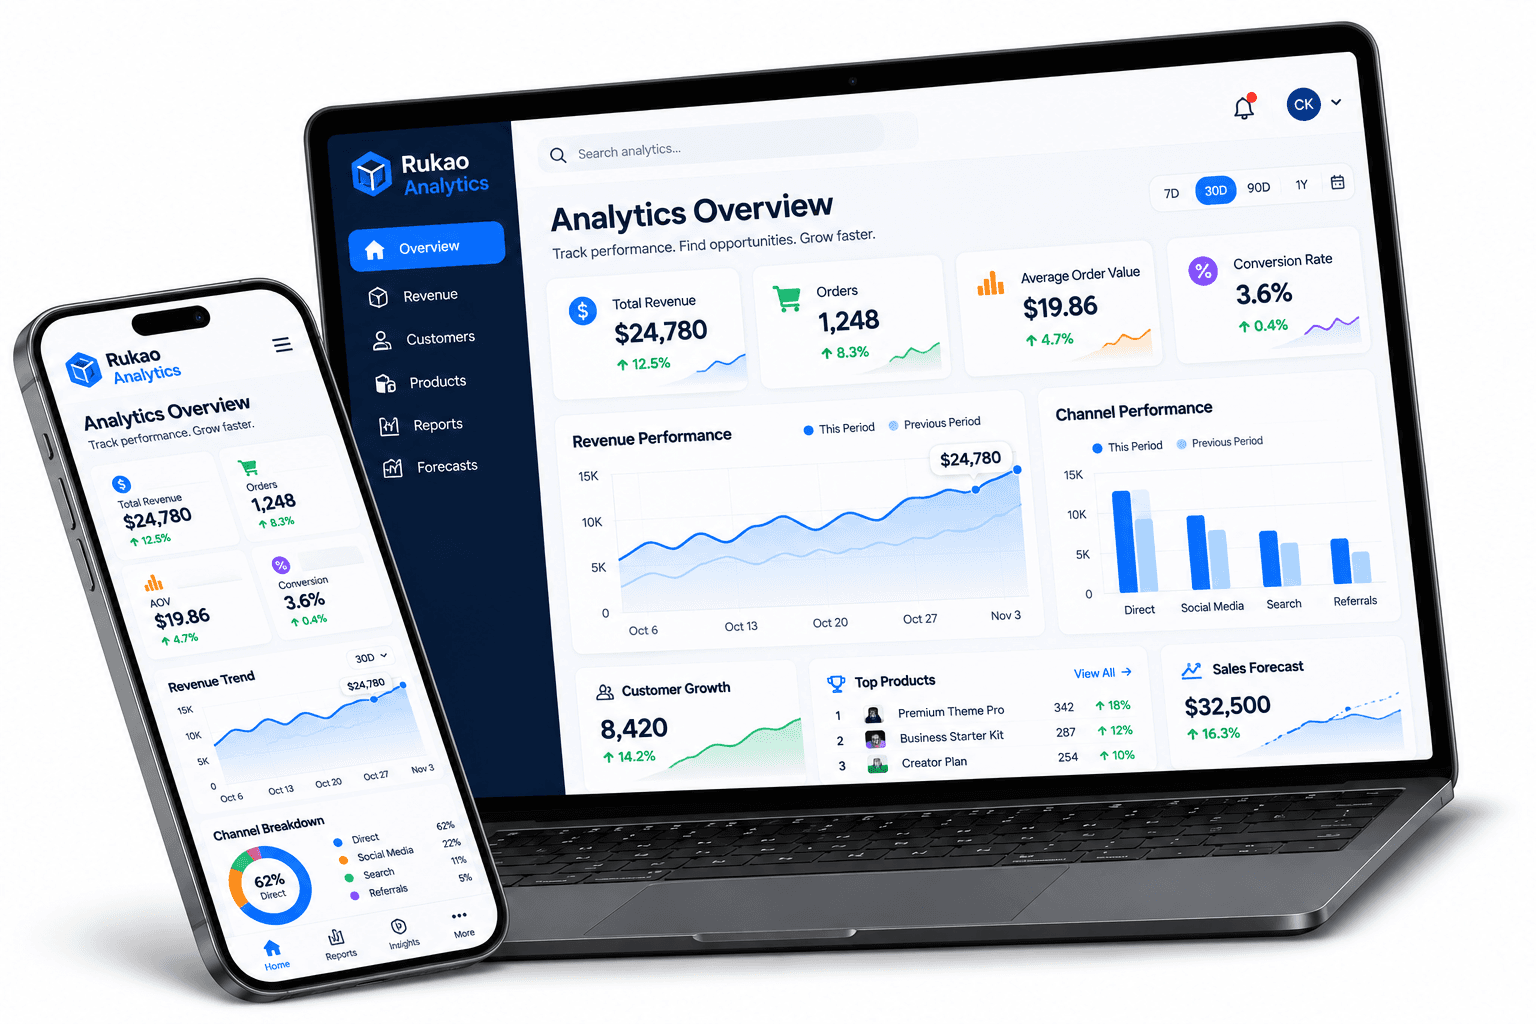
Live dashboards gather data from your branches, sales counters and warehouses into clear KPIs you can read in seconds.
The problem
By the time you see the decline, the chance to act has gone
Owners, managing directors and finance heads usually wait days or weeks after month-end for consolidated reports. A branch loses revenue, stock stops moving or a supplier raises prices, and leadership learns about it when the window for correction has already closed.
Our approach
One screen that updates as your business trades
We build live dashboards that gather data from every branch, counter and warehouse into clear KPIs: daily revenue, gross margins, branch stock value and order turnaround. Open one screen and know where the business stands.
What you get
Executive overview consoles with daily and weekly KPIs
Multi-branch sales, revenue and product margin comparisons
Fast-moving and slow-moving stock ageing analytics
One-click CSV and PDF summary exports
Instant KPIs from your spreadsheets
Lintel Analytics is a browser-based engine that turns messy CSV spreadsheets into executive KPI cards and category breakdowns, without exposing sensitive data.
Meet Lintel AnalyticsDecide what you want to see each morning
Tell the founders which three numbers you check first. We will show you how a dashboard would deliver them.